| Back to Back Issues Page |
 |
|
English Detective #98 Good—and bad-- news about global poverty 1-16-18 January 16, 2018 |
Have you heard the good news about the huge drop in world poverty rates? There IS a real drop, but the truth is a little more complicated. This issue discusses two articles (& an optional TED talk) that analyze the changing poverty situation. Then you can read an explanation of charts and graphs and practice chart vocabulary.
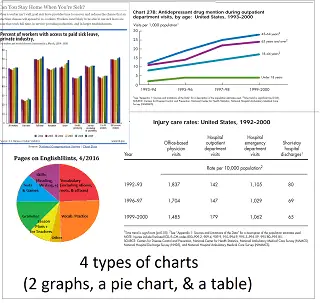
Chart & Graph Vocabulary
Here’s a page that explains how to read charts and graphs, and demonstrates a lot of chart vocabulary (x or y axis, (steady, sharp, significant, major or minor) increase or decrease, trend, range, approximate, etc. It also suggests ways to practice. A note if you get gmail: Have you missed any issues of English Detective? if you find English Detective in your Promotions box, you can move it to your Primary box (if you want) by clicking on it and dragging it there, then clicking Yes when asked if you want to always get it in the Primary box. If you are not already getting English Detective, you can subscribe by completing the form here. (It's free!) Also, you can reach me by mail at 1752 Driftwood Drive, El Centro, CA 92243, USA. |
| Back to Back Issues Page |